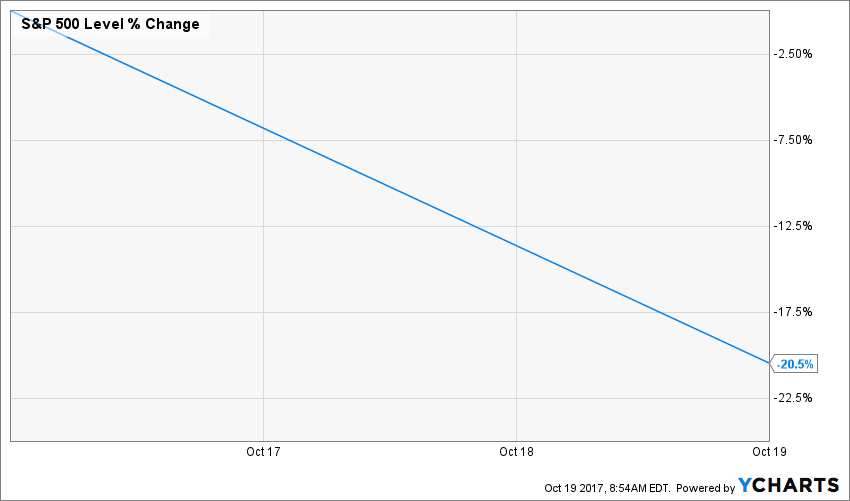
30 years ago today, while I was getting upset about having to go to another day at school, investors had another reason to be upset:
Source: Ycharts
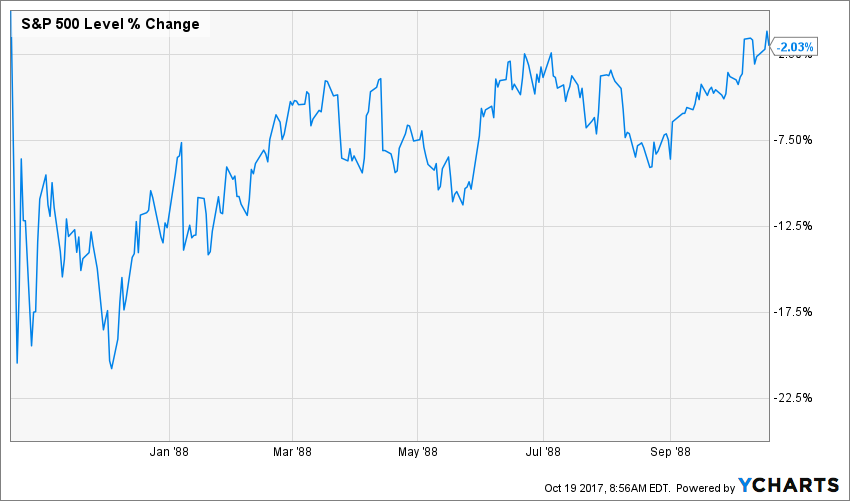
In a single day, the market lost over 20%. It took over a year for the market to recover from this single fatal day:
Source: Ycharts.
I’m writing this article before the market opens today. While I acknowledge some strange movement on the stock market this week (notably both GWW and IBM surging by 10% upon the release of their quarterly results), I doubt we are going to celebrate this dark anniversary with another crash. It doesn’t hurt to get back in time and learn from what happened, though.
What happened on October 19th 1987?
I did some reading about this event over the past two weeks and tried to understand what happened to the world when the most important thing that went through my mind that morning was to make sure I could play with the firetruck in kindergarten. I was disappointed that the recipe for the worst day on the stock market contained the same ingredients as the soup we had in 2008. And we might as well be cooking our next crash, since we are following the exact same recipe again.
An overheating market
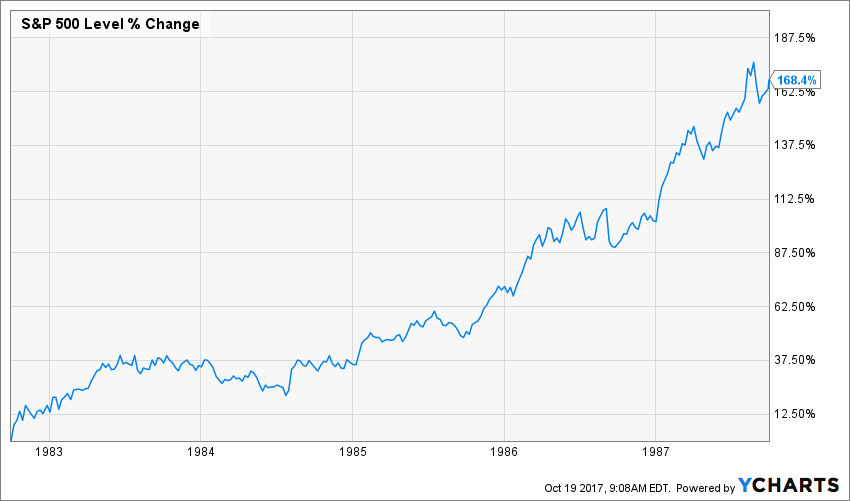
There was a party on the stock market for a good 5 years prior to the crash. After over a decade of bad returns (the S&P 500 went up by 36% between October 1st1965 and October 1st 1982), investors were finally rewarded for their patience. Between October 1st 1982 and October 1st 1987, the market jumped by 168%:
Source: Ycharts
As the market kept reaching new highs, investors started to get nervous (does this rings a bell?). Everybody was expecting the worst… and then it happened.
Automatic trading
From as long as I can remember, human beings have had a weird obsession about technology making everything better. Although it is often the case, we still think that technology will magically solve ALL of our problems. Wall Street was trying a new technology at large on that day. It was meant to protect investors from downsides on the market by using automatic trading and option writing. What really happened then was that this marvelous technology created a downward spiral of automatic selling.
As the panic spread, margin calls started to happen, forcing additional sales. Investors were withdrawing their money from the market, forcing mutual funds companies toward massive sell-offs to reimburse their units holders. In other words, 1987 was just a simplified version of what happened in 2008.
What is going to happen now?
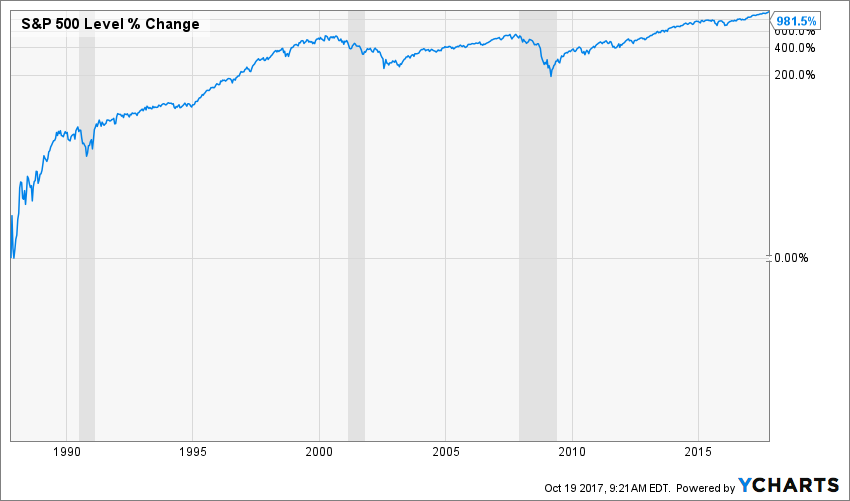
We are now 30 years and 900%+ points since the market crash of ’87. To put things in perspective, I’ve used a log scale chart to show you what has happened on the stock market since then:
Source: Ycharts
The gray areas represent recessions. As you can see, there was a decade between the recessions in the 90’s and the 2000’s. Then, the 2008 recession came faster and lasted longer. As you can see on this graph, the 2008 crash doesn’t look that bad anymore. But off course, this is only valuable if you intend to invest over the next 30 years.
While investors have been getting nervous lately, they have something to calm them down. The U.S. economy keeps growing and the FED raises the interest rate accordingly. Even better, it has also put a stop to the QE madness by withdrawing money as investing products expire.
The earnings season started out on the right foot with many companies declaring sales and profits beat. Just to name a few: JPM, IBM, GWW, JNJ, etc. Let’s hope this continues in the upcoming weeks and that we will have another sign that the current bull market is here to stay. This is what I believe: I think we will continue to ride a bull market for at least another 12 months. There is nothing telling me otherwise. As long as companies continue to show growing revenues, earnings will follow and dividend increases will continue.
In the meantime, I continue to invest money…
This article was written by Dividend Monk. If you enjoyed this article, please subscribe to my feed [RSS]


